WHAT IS A MONTE CARLO MODELING AND WHY DOES THE APP UTILIZE IT?
Developed by John von Neumann and Stanislaw Ulam in the 1940s, Monte Carlo models utilize statistics and math to predict the outcome of unknown future events. Known as a “probabilistic model,” Monte Carlo scenarios can incorporate an element of uncertainty or randomness into their predictions. The models will return different results every time, but – when taken on a large scale – they can determine the probability of specific outcomes.
For example, the distance between your home and office remains constant, but your commute can vary depending on factors such as traffic, weather, accidents, errands, or breakdowns. You could use a Monte Carlo model to simulate 1,000 trips to and from work. The results would show you a consistent median travel time, but also high and low probabilities.
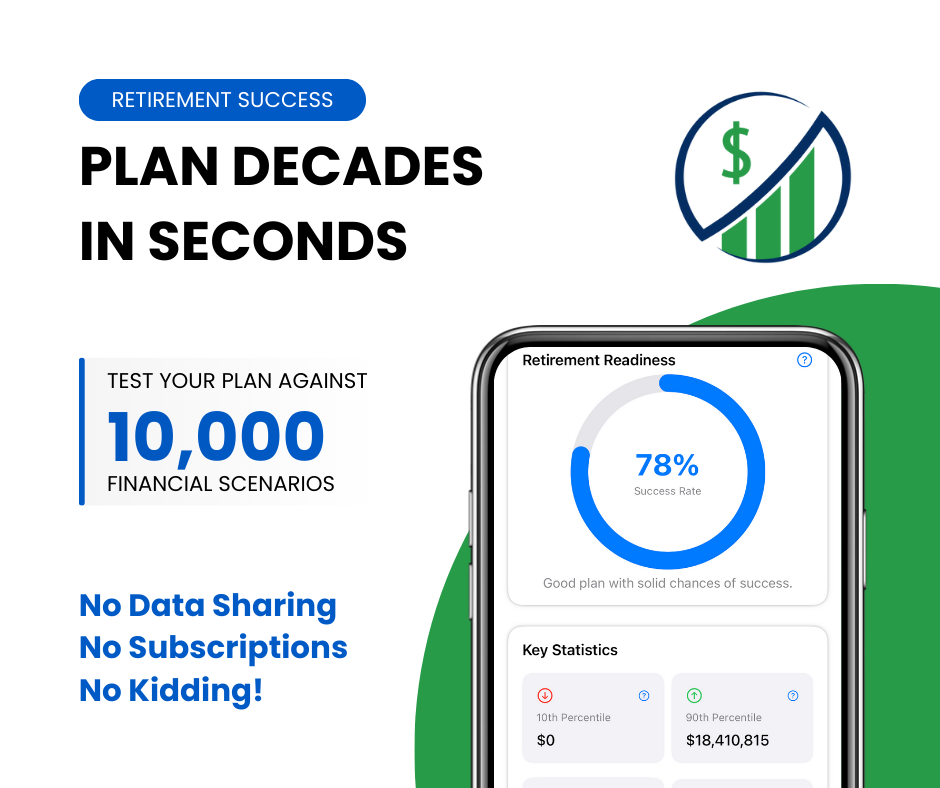
For your investment plan, Monte Carlo tests will factor in decades of economic variables to test your investment plan. The Retirement Success Graph app runs up to 10,000 different variations to determine if your investment plan is likely to meet your financial goals. By continually changing the variables of investment returns, inflation, expense variations, market variables, and many more, the app can provide a high level of statistical accuracy for your retirement plan and help guide you on your path to Financial Independence and Retiring Early.
MORE RESOURCES:
Wikipedia: Monte Carlo Methods
IBM: Monte Carlo Simulations
CFI: Monte Carlo Simulation – How it Works
WHY IS THIS APP FREE… & AD FREE? WHAT’S THE CATCH?
I was fortunate enough to retire early, but – along the way – found that most helpful resources lived behind either paywalls or subscriber models. But Monte Carlo methods for predicting future outcomes are basic math equations. (You can even create them in Excel!) So, having to pay hundreds of dollars or surrender your privacy didn’t seem to make much sense. Worse, most of these sites were only usable on actual computers; smartphone support was abysmal.
The Retirement Success App makes these complex tools available to anyone – for free, with no advertising or registration required. It’s my way of giving something back in the same way that others advised me. The Premium version offers more features and functionality for a small, one-time purchase price. These funds will go towards hosting and app development, allowing me to add more features to future versions.
With more time to pursue passion projects, I’m learning new skills (such as making iOS apps) and using some of my past strengths to try to help others. You can find me on the Casual Mondays Podcast, where I talk about early retirement and finding new passions in retirement, or online at KevinDonahue.com.
CAN I REALLY USE THIS TO PLAN MY RETIREMENT?
The Retirement Success App is one tool – albeit a relatively powerful one – to help you plan your financial independence. While the app cannot create a financial roadmap for your retirement, it’s particularly effective at validating your plans for financial independence and early retirement (a.k.a. FIRE).
For more information on retirement planning, please consult a Certified Financial Planner. If you’d like to learn more about the FIRE method for financial independence and retiring early, see “Lessons from the r/fire community“.
CAN YOU SHOW ME HOW TO USE THE APP?
Absolutely. Click to view our “How To Analyze Your Retirement Plan” on YouTube.
WHY DO I GET DIFFERENT RESULTS WITH THE SAME INPUTS?
Monte Carlo models utilize statistics and math to predict the outcome of unknown future events. Known as a “probabilistic model,” Monte Carlo scenarios can incorporate an element of uncertainty or randomness into their predictions. The models will return different results every time, but – when taken on a large scale – they can determine the probability of specific outcomes.
The Retirement Success Graph App runs 50 (Free Model) or up to 10,000 (Premium Model) simultaneous simulations up to age 95 from your inputs on the PLAN tab. Every simulation (each of the 50 free models or each of the 10,000 premium models) will produce a different outcome because economic conditions, growth rates, market variations, recessions, expansions, innovations, and political environments will differ in each successive year through age 95.
As an analogy, we know the distance between your home and office remains the same every day, but your commute can vary depending on factors such as traffic, weather, accidents, errands, or breakdowns. You could use a Monte Carlo model to simulate 10,000 trips to and from work. The results for every simulation would vary, but the totality of the results would generate insights on average commute times, below average, significantly below average, and so on. The Retirement Success App does much the same thing, but for your retirement savings towards financial independence.
HOW IS THIS DIFFERENT FROM BOLDIN?
After evaluating retirement planning tools, I found that most required monthly subscriptions, uploaded my financial data to the cloud, and performed far too few simulations for me to trust the results. I wanted more than a $150 subscription just to manage my money. So I stopped using Boldin and built Retirement Success Graph. You can learn more on how it differs from Boldin here.
CAN YOU ADD [FEATURE] TO THE APP?
I would love to get your input and suggestions on how to improve the app. Please see the Development Roadmap for planned features and to suggest additional enhancements.
I NEED HELP WITH THE APP.
Firstly, I’m sorry you’re having difficulties. There are some really complex models powering the app, so I appreciate the feedback.
Please visit the support page to send any questions, suggestions, or requests.