

If you’re serious about retirement planning, you’ve probably heard of Boldin (formerly NewRetirement). It’s one of the most popular online retirement calculators, praised by financial bloggers and FIRE enthusiasts alike. I used it myself for years.
But after diving deep into how these tools actually work—and what they cost over time—I realized I needed something different. That’s why I built Retirement Success Graph.
This isn’t a hit piece on Boldin. It’s a robust platform with many features. But for DIY planners who value privacy, simplicity, and statistical rigor, there are compelling reasons to consider an alternative. Here are five that drove my decision.
1. The Subscription Model Never Made Sense to Me
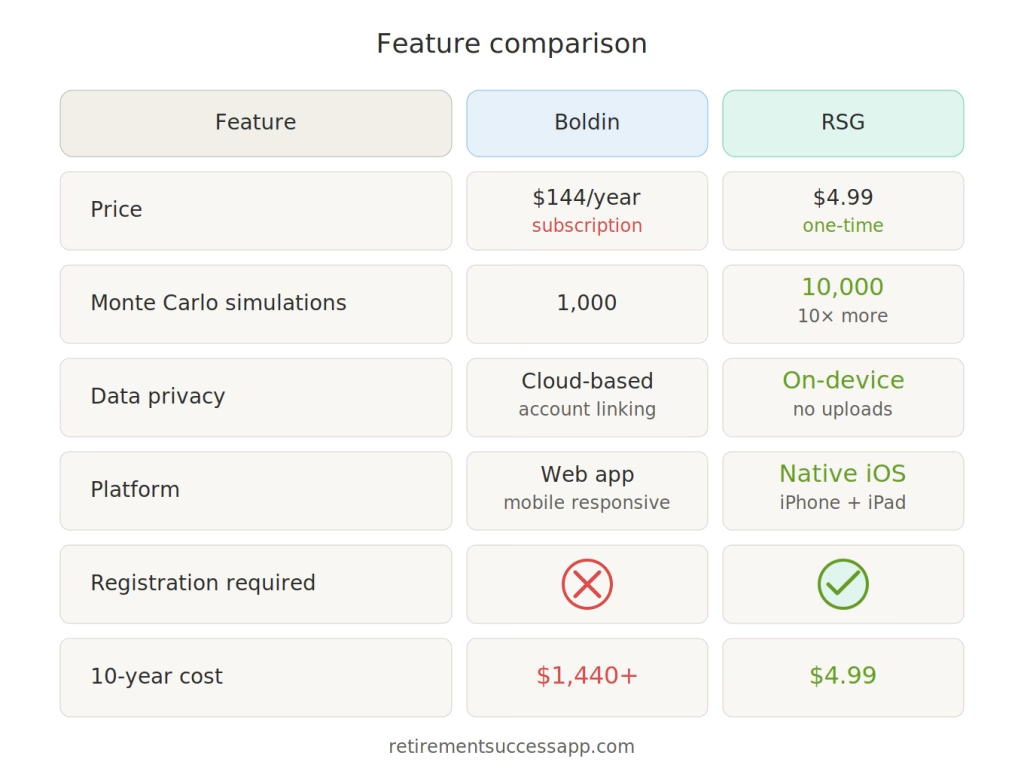
Boldin’s PlannerPlus tier costs $144 per year (recently increased from $120). That’s $12/month for access to what are essentially mathematical calculations that any computer can perform. Over a 30-year retirement, you’re looking at $4,320 or more just to run projections on your own money.
Monte Carlo simulations are based on well-established statistical methods—they’re not proprietary magic. As research from Kitces.com explains, these techniques have been used in financial planning for decades, with 1,000 scenarios being the typical industry standard.
Retirement Success Graph offers a one-time $4.99 premium upgrade. No subscriptions. No recurring charges. No annual price increases. You pay once, you own it forever.
2. 1,000 Simulations Isn’t Enough—We Run 10,000
Here’s something most users don’t realize: Boldin’s Monte Carlo simulation runs exactly 1,000 iterations. That’s the industry standard, but it’s the bare minimum for statistical validity.
Why does this matter? According to research published on Kitces.com, while 1,000 scenarios provide adequate results for typical probability levels, variation can be significant at the extremes—precisely where retirees need the most confidence.
Retirement Success Graph runs up to 10,000 simultaneous simulations for premium users. That’s 10x the statistical power, providing tighter confidence intervals and more reliable projections. Even our free tier runs 50 simulations—enough to give you a meaningful snapshot without requiring any payment or registration.
3. Your Financial Data Stays on Your Device—Period
This is the issue that concerned me most. Boldin encourages users to link their financial accounts through services like Plaid, MX, and Finicity. While Boldin claims SOC2 Type 2 certification and bank-level encryption, the fundamental architecture requires your data to live on their servers.
The Bogleheads community has raised valid concerns about this approach. As one cybersecurity professional noted: “Never link through Plaid or anything else with your entire nest egg… Cyber risk is a greater risk than market risk.”
Even Fidelity, with all its resources, experienced a data breach affecting 77,000 clients in late 2024. Cloud-based financial data is inherently vulnerable.
Retirement Success Graph takes a fundamentally different approach: all calculations happen entirely on your iPhone. Your financial data never leaves your device. There are no accounts to create, no passwords to remember, no cloud uploads, no data aggregation services. If someone hacks our servers, they get nothing—because we don’t have your data.
4. Complexity Can Be the Enemy of Clarity
Boldin markets itself as “comprehensive,” and it is. The platform includes 250+ inputs, linked account aggregation, Roth conversion optimizers, estate planning modules, long-term care modeling, and connections to CFP advisors.
For some users, that’s exactly what they need. But for many FIRE-focused planners, this complexity creates more noise than signal. Research from Michael Kitces has shown that adding more variables to Monte Carlo models can actually decrease accuracy unless correlation matrices are properly calibrated—something most users can’t verify.
Retirement Success Graph focuses on what matters most: your savings, withdrawal rate, time horizon, and asset allocation. Our Guided Interview mode walks you through the essentials in minutes, while Expert Mode gives power users granular control over account types, recurring income streams, variable expenses, and advanced withdrawal strategies like the Bucket Method and Bond Ladder.
The result? Faster insights, clearer outcomes, and less time wrestling with software.
5. I Needed a Tool Built for Mobile—Not Adapted for It
Boldin is a web-first platform. While it works on mobile browsers, it wasn’t designed for the way most of us actually use our phones. Scrolling through dozens of input fields on a laptop is one thing; doing it on an iPhone is another.
Retirement Success Graph is a native iOS app, built from the ground up for iPhone and iPad. The interface uses Apple’s design patterns, supports haptic feedback, and renders results in seconds—not after waiting for server round-trips. You can run a full 10,000-scenario simulation while waiting for your coffee.
What Boldin Does Well
To be fair, Boldin excels in several areas that may matter to certain users:
- Account aggregation: If you want all your balances pulled automatically, Boldin’s Plaid integration does that.
- Comprehensive planning: Estate planning, long-term care, IRMAA optimization, and more.
- Advisor access: Their PlannerPlus tier includes live Q&A sessions, and the $2,800/year tier provides CFP access.
- Educational content: Extensive blog, courses, and community resources.
If those features align with your needs and you’re comfortable with the subscription model and cloud architecture, Boldin is a legitimate choice.
The Bottom Line
For me, the math was simple:
I built Retirement Success Graph because I wanted the analytical power of professional-grade Monte Carlo simulation without surrendering my privacy, paying perpetual fees, or navigating overwhelming complexity.
If you’re part of the FIRE community, approaching early retirement, or simply want to stress-test your financial plan without handing your data to another company, I’d invite you to give it a try.
The free version gives you 50 simulations with no registration. The premium upgrade is less than a single month of Boldin’s subscription—and it’s yours forever.
Disclaimer: This article reflects my personal experience and analysis. Retirement Success Graph is developed by CHEZ MER STUDIOS. This is not financial advice. All retirement planning tools, including this app, are for informational purposes only. Consult a qualified financial advisor before making significant financial decisions.
Related Posts: