Whether you’re new to FIRE or a longtime user, version 2.0 delivers the professional-grade analysis you need—with a whole new level of accessibility.
A Message to Our Community
Six months ago, we launched Retirement Success Graph with a simple promise: bring Wall Street-level Monte Carlo simulation to individual investors without the Wall Street price tag—or the privacy violations.
Your response exceeded our expectations. Hundreds of FIRE pursuers, early retirees, and pre-retirees have trusted us with their retirement planning. You’ve run tens of thousands of Monte Carlo scenarios. You’ve validated your 4% withdrawal strategies. You’ve stress-tested your plans against market crashes and sequence-of-returns risk.
And you’ve told us what you needed next.
Today, I’m thrilled to announce Retirement Success Graph version 2.0—our most significant update yet, built directly from your feedback.
For New Users: Why This Matters
If you’re just discovering Retirement Success Graph, welcome to the FIRE community’s privacy-first retirement planning tool.
Here’s what makes us different:
???? Privacy Isn’t a Feature—It’s Our Foundation
- No registration required. Download and start planning in 60 seconds.
- No data uploads. All calculations run on your device.
- No subscription tracking. Your financial data belongs to you, not our servers.
- No ads. Ever. Your attention isn’t for sale.
???? Professional-Grade Analysis at Consumer Pricing
Most financial advisors charge 1% of assets under management annually. For a $1M portfolio, that’s $10,000 per year—every year—for access to Monte Carlo analysis tools.
We charge $4.99. Once. Forever.
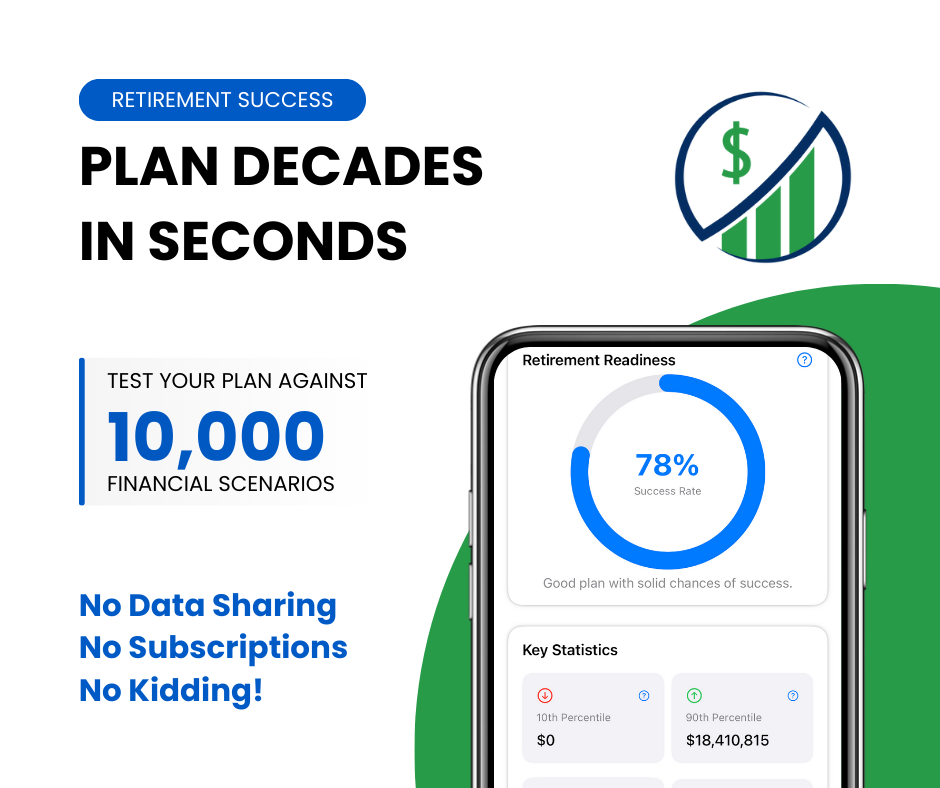
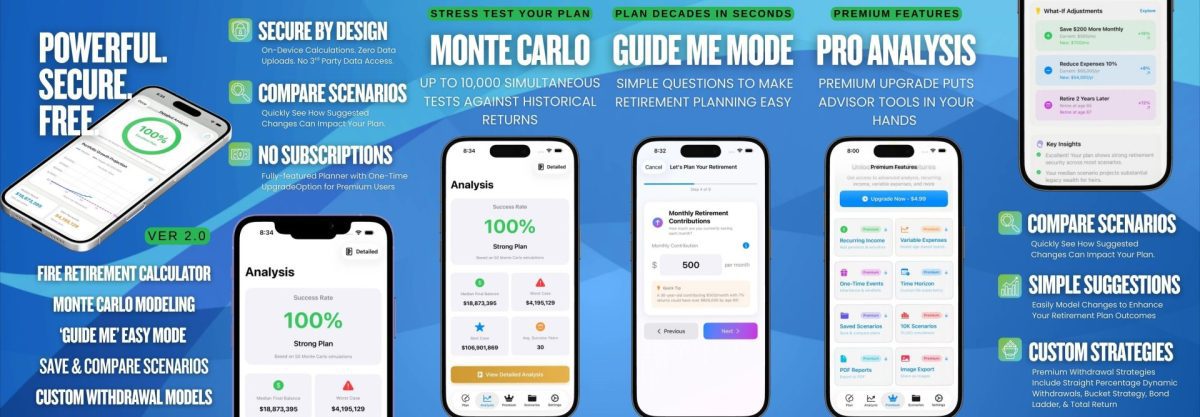
Our Monte Carlo engine runs up to 10,000 simultaneous scenarios, testing your retirement plan against decades of market volatility, inflation spikes, and sequence-of-returns risk. It’s the same statistical modeling used by institutional advisors managing billions—now accessible to DIY investors.
???? Built for the FIRE Community
This isn’t a generic retirement calculator assuming you’ll work until 65 and spend 80% of your pre-retirement income. Retirement Success Graph was designed specifically for:
- Early retirees targeting financial independence in their 40s and 50s
- Pre-retirees (ages 40-65) who want data-driven confidence in their plans
- DIY investors who value precision over hand-waving estimates
- Couples coordinating Social Security claiming strategies
- Anyone who refuses to choose between professional tools and personal privacy
What’s New in Version 2.0
???? Two Paths, One Destination: Dual Entry Modes
The biggest change in v2.0? You now choose how you want to plan.
Guided Interview Mode (NEW)
Perfect for first-time users or anyone who wants a structured approach. Our 9-step interview walks you through:
- Your Current Age
- Target Retirement Age
- Current Retirement Savings
- Monthly Contributions
- Expected Monthly Expenses
- Social Security Planning
- Investment Risk Tolerance
- Inflation Assumptions
- Plan Review & Analysis
Each step includes contextual help explaining what information matters and why. By the end, you’ll have a comprehensive retirement plan ready for Monte Carlo analysis—no financial background required.
Expert Mode
For experienced investors who know exactly what they need. Direct data entry, full control, no hand-holding. Jump straight to your analysis.
Flexible Launch Preferences
Choose your preferred mode once, or select “Ask Every Time” to pick your path at each launch. The app adapts to your workflow.
???? Complete Design Overhaul
Version 2.0 introduces professional glassmorphism design throughout the entire app. Modern, intuitive, and beautiful—with improved navigation that makes complex analysis feel effortless.
Every screen has been reimagined for clarity and speed. Charts load faster. Forms are more intuitive. Information hierarchy guides you naturally through your analysis.
???? Configurable Professional Reports (Premium)
Premium users can now generate customized reports in four professional formats:
- Executive Summary: Clean, concise overview for quick decision-making
- Detailed Analysis: Comprehensive breakdown with all metrics and scenarios
- Advisor-Ready: Professional documentation including methodology, assumptions, and raw data
- Charts Only: Visual-first export perfect for presentations or social sharing
Export formats include:
- PDF (professional reports)
- PNG images (high-resolution charts)
- HTML (web-compatible analysis)
- CSV (spreadsheet-ready data)
Meeting with a financial advisor? Generate an Advisor-Ready PDF with complete documentation of your assumptions, methodology, and results. Planning a presentation? Export Charts Only as high-resolution images.
???? Enhanced Premium Features
Premium users ($4.99 one-time upgrade) now access even more sophisticated withdrawal strategies:
- Dynamic Withdrawal: Adjusts spending based on portfolio performance
- Bucket Strategy: Segregates assets by time horizon for stability
- Bond Ladder: Creates predictable income streams through maturity matching
- Total Return: Optimizes for growth while meeting spending needs
Each strategy includes detailed explanations of when and why to use it, plus real-time comparison of how different approaches impact your success probability.
⚡ Performance Improvements
- Faster Monte Carlo calculations: 10,000 scenarios now run 30% faster
- Improved data persistence: Your scenarios save automatically with better reliability
- Optimized scenario comparisons: Side-by-side analysis loads instantly
- Enhanced monthly contributions integration: Now properly factored throughout the entire analysis engine
Core Features (For New Users)
Here’s what you get with Retirement Success Graph, free and premium:
Free Version:
- 50 Monte Carlo simulation scenarios
- Success probability analysis
- Interactive portfolio growth charts
- Inflation-adjusted projections to age 95
- 4% rule validation
- Social Security integration
- Scenario saving and comparison
- Both Guided and Expert entry modes
- Complete privacy protection
Premium Upgrade ($4.99 one-time):
- 10,000 Monte Carlo simulations (maximum statistical accuracy)
- Social Security optimization with spousal coordination
- Advanced withdrawal strategies (Dynamic, Bucket, Bond Ladder, Total Return)
- Configurable PDF reports (Executive, Detailed, Advisor, Charts-Only)
- Multiple export formats (PDF, PNG, HTML, CSV)
- Unlimited scenario comparisons
- Priority support
Real-World Use Cases
Scenario 1: First-Time FIRE Planner
Sarah, 32, Software Engineer
Sarah just discovered FIRE and wants to know if early retirement at 45 is realistic. She’s saved $200K but isn’t sure about withdrawal rates, Social Security timing, or market risk.
Her v2.0 approach:
- Launches Guided Interview Mode for the first time
- Answers 9 simple questions (takes 5 minutes)
- Reviews her complete plan on the summary screen
- Runs 50 free Monte Carlo scenarios
- Sees 73% success probability—encouraging but not quite there
- Adjusts retirement age to 47, re-runs analysis
- New success rate: 89%—now she has a data-driven target
Scenario 2: Pre-Retiree Stress Testing
Michael & Jennifer, 58 & 56, Early Retirement Next Year
The couple has $1.2M saved and plans to retire next year. They want to stress-test against sequence-of-returns risk and optimize their Social Security claiming strategy.
Their v2.0 approach:
- Uses Expert Mode for direct data entry
- Upgrades to Premium ($4.99) for 10,000 scenarios
- Tests multiple Social Security claiming ages
- Compares 4% rule vs. Dynamic Withdrawal strategy
- Generates Advisor-Ready PDF for their fee-only planner
- Validates their plan shows 92% success across all market conditions
Scenario 3: Annual Plan Review
David, 44, Three Years into FIRE
David retired at 41 with $800K. He reviews his plan annually to ensure he’s still on track despite market volatility.
His v2.0 approach:
- Opens his saved “Base Plan” scenario from last year
- Updates current portfolio value (now $875K after market gains)
- Adjusts annual expenses (increased slightly with lifestyle creep)
- Re-runs 10,000 scenarios with updated data
- Success rate improved from 85% to 89%—he’s ahead of plan
- Exports Charts Only PNG to share success on r/FIRE
The Philosophy Behind the App
I built Retirement Success Graph after my own early retirement at 52. I spent 25+ years in luxury hospitality sales and marketing—industries built on relationships, trust, and delivering exceptional value.
When I started planning my own FIRE journey, I was frustrated by the options:
- Expensive financial advisors charging 1% AUM for tools I could use myself
- Subscription calculator services requiring monthly fees forever
- Free tools that monetized by selling my data to advertisers
- Oversimplified calculators that ignored sequence-of-returns risk
None of them aligned with FIRE principles: independence, self-reliance, data-driven decisions, and value optimization.
So I built what I wished existed:
- Professional-grade Monte Carlo analysis
- One-time purchase, own forever
- Complete privacy protection
- No subscriptions, no data harvesting, no ads
- Built for FIRE, by someone who achieved FIRE
Version 2.0 extends that philosophy: make professional retirement planning accessible to everyone, regardless of experience level, without compromising on privacy or analytical rigor.
What’s Coming Next
Version 2.0 isn’t the end—it’s a foundation. Here’s what we’re exploring for future releases:
- Variable expenses modeling: Plan for changing spending patterns (travel years, healthcare, downsizing)
- One-time events: Factor in inheritances, home sales, major purchases, windfalls
- Recurring income streams: Model pensions, rental income, part-time work
- Customizable time horizons: Plan to age 80, 90, or 100 based on your health and longevity expectations
- Gamification features: Visual milestones like “On Track,” “At Risk,” “Ahead of Plan”
- Smart insights: Automated suggestions like “Reducing withdrawal rate by 0.5% increases success probability from 72% to 88%”
All requests from users like you. Keep the feedback coming.
Download v2.0 Today
For Existing Users:
Version 2.0 is a free update available now in the App Store. Your existing scenarios, preferences, and premium access carry over automatically. Update today and explore Guided Interview Mode, generate professional reports, and experience the new design.
For New Users:
Download Retirement Success Graph free and run your first 50 Monte Carlo scenarios today. Test your retirement plan against thousands of market conditions. Validate your FIRE timeline with statistical confidence.
When you’re ready for maximum accuracy, upgrade to Premium for $4.99 (one-time) and unlock 10,000 scenarios, advanced withdrawal strategies, and professional report generation.
Download Free on the App Store →
Join the Community
Retirement Success Graph users are active in FIRE communities across Reddit, personal finance forums, and early retirement blogs. Share your success stories, ask questions, and help others achieve financial independence.
- Reddit: Find us discussing FIRE strategies on r/financialindependence and r/FIRE
- Email: kevin@retirementsuccessapp.com
- Podcast: Casual Mondays Podcast (early retirement strategies)
- Website: RetirementSuccessApp.com
A Personal Thank You
To everyone who downloaded version 1.0, sent feedback, reported bugs, suggested features, and shared the app in FIRE communities—thank you. You made this update possible.
Version 2.0 represents hundreds of hours of development, all funded by one-time $4.99 premium purchases. No venture capital. No subscription revenue. Just a sustainable model that respects your privacy and your wallet.
That’s only possible because you believed in what we’re building.
Here’s to your retirement success.
Kevin Donahue
Developer, Retirement Success Graph
P.S. — If Retirement Success Graph helped you achieve FIRE confidence, the best way to support the app is leaving an App Store review. It helps other FIRE pursuers discover professional-grade tools that respect their privacy.